DESTINATION NSW WISHES EVERYONE A SAFE AND JOYFUL HOLIDAY SEASON AND A HAPPY, SUCCESSFUL NEW YEAR

NSW visitor economy performance 2023-2024

The visitor economy in NSW and Australia continues to recover from the impact of COVID-19, while also weathering the cost-of-living crisis. Although overall visitor numbers in FY23–24 dropped in NSW (compared to FY22–23) due to a sharp decline in domestic day trips and had yet to reach pre-pandemic levels, visitor nights and expenditure showed improvement. These results surpassed both the prior year and pre-pandemic levels. In FY23–24, NSW recorded its highest total visitor expenditure on record since 1998.

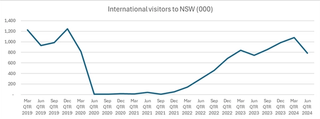
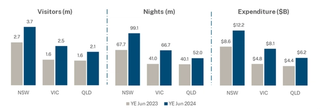
Overall, NSW received 101.6 million total visitors, down 3.6 percent from FY22–23. These visitors stayed 216 million nights (up 18.3 percent) and spent $52.9 billion (up 9 percent from the previous year). Over the past 12 months, international visitors increased by 35.6 percent and domestic overnight visitors by 2.6 percent, though domestic day trips fell by 8.7 percent year-on-year.

Compared to the pre-COVID-19 period, international visitors to NSW were down by 0.7 million, domestic overnight visitors by 0.1 million, and domestic day trip visitors by 8.4 million. On a positive note, all three visitor types saw expenditure above pre-pandemic levels, with both domestic and international nights surpassing FY18–19 levels.

Domestic day trip visitors accounted for 60 percent of all visitors to NSW and 19 percent of expenditure in FY23–24. NSW’s domestic overnight visitor share was 37 percent, contributing 58 percent of the state’s visitor expenditure. International visitors made up only 4 percent of total visitation but accounted for 23 percent of expenditure.

International performance

NSW: Year ended 30 June 2024

NSW continued to lead Australia, receiving 50 percent of all international visitors to the country, who stayed 36 percent of all nights and contributed 39 percent of all expenditure.

NSW received 3.7 million international visitors (up 35.6 percent compared to FY22–23), who stayed 99.1 million nights (up 46.2 percent) and spent $12.2 billion (up 41.9 percent). These results demonstrate continuous improvements in international visitation to NSW since FY18–19. However, international visitors were still 15 percent short of pre-COVID levels.

International visitation to NSW increased by 1.0 million visitors in FY23–24, but compared to FY18–19, international visitors were still down by 0.7 million. This year, the top three international source markets for NSW were the USA, New Zealand, and China, with the most common purpose of visit being a holiday.

Domestic performance

NSW: Year ended 30 June 2024

NSW received 97.9 million domestic visitors (down 4.7 percent on FY22–23) who spent $40.7 billion (up 1.9 percent). Overnight visitors stayed 117 million nights (up 1.8 percent). NSW maintained its leading position across all states and territories in visitors, nights, and expenditure, accounting for 31 percent of total visitors, 29 percent of total nights, and 29 percent of total expenditure in Australia.

There were 37.1 million domestic overnight visitors (up 2.6 percent) and 60.8 million domestic day trip visitors (down 8.7 percent). Overnight visitors spent $30.7 billion (up 1.5 percent) in NSW, while day trip visitors spent $10.0 billion (up 3.1 percent).

Sydney

Sydney received 34.1 million domestic visitors (down 4.4 percent compared to FY22–23) who spent $15.7 billion (up 7.5 percent). Sydney leads all Australian capital cities in domestic visitation for visitors, nights, and expenditure, accounting for 27 percent of total visitors, 24 percent of total nights, and 26 percent of total expenditure to capital cities. Sydney recorded its highest expenditure since 1998.

The domestic overnight market saw an increase to 11 million visitors (up 2.7 percent), with visitor nights rising to 31.5 million (up 4.7 percent), and expenditure growing to a record $11.8 billion (up 6.5 percent). The domestic day trip market experienced a decline, with visitor numbers dropping to 23.1 million (down 7.4 percent), but expenditure rose to $3.9 billion (up 10.7 percent).

Regional NSW

Regional NSW had 64.7 million domestic visitors (down 4.8 percent) who spent $24.9 billion (down 1.3 percent). It leads all regional Australia in visitors and nights, representing 33 percent of total visitors and 32 percent of total nights. However, it slightly trails regional Queensland in visitor expenditure share (30 percent vs. 31 percent).

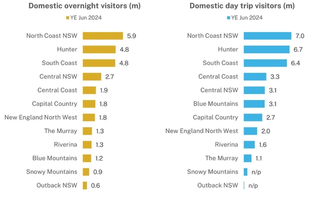
In the domestic overnight market, visitors increased to 27 million (up 2.5 percent), and visitor nights rose to 85.5 million (up 0.8 percent), though expenditure fell to $18.9 billion (down 1.4 percent). The North Coast was the most visited region, followed by the Hunter and South Coast. The Hunter (up 277,300 visitors) and North Coast (up 240,000 visitors) drove growth, while Capital Country recorded a notable increase of 248,600 visitors (up 15.5 percent). Despite half of the regions reporting increased expenditure, the Snowy Mountains (down $382 million) and North Coast NSW (down $296 million) saw significant declines.

In the domestic day trip market, regional NSW experienced a drop in visitors (down 9.4 percent to 37.7 million) and expenditure (down 1.2 percent to $6.1 billion). The North Coast, Hunter, and South Coast attracted the most day trip visitors, primarily holidaymakers. The North Coast and Blue Mountains saw increases in visitor numbers, while the South Coast (down 1.6 million) and Central Coast (down 0.9 million) recorded the largest declines. In expenditure, the Central Coast (down $107 million) and Capital Country (down $73 million) faced the steepest decreases.

Factors contributing to performance

With concerns about COVID-19 continuing to recede, international travel has shown strength in recovery. International visitor numbers to NSW in FY23-24 are at 85 per cent of the pre-pandemic FY18-19 level, and this period achieved the fourth-highest international visitor numbers on record for a financial year (with the top three all immediately before the pandemic, 2017-19). The continued recovery of international aviation capacity (currently at 95 per cent of the FY18-19 level) has also contributed to the return of overseas visitors to Australia.

Countries that were quicker to return to international travel, such as the UK and USA, have seen a stronger rebound with both around 90 per cent of their pre-pandemic level. Conversely, markets that were slower to reopen for travel, such as China, Hong Kong and Japan, have been slower to rebound. China, which was the top source market for NSW in YE June 2019 with 755,000 visitors, only reached 54 per cent of that level at YE June 2024. China reopened its borders in January 2023, before fully reopening to tourists in March 2023.

“While the impact of the pandemic on travel has continued to lessen, economic concerns continue to impact both domestic and international travel.”

In August 2023, the Chinese Government announced that Australia had received Approved Destination Status allowing Chinese Tourists to travel to Australia in guided groups.

While the impact of the pandemic on travel has continued to lessen, economic concerns continue to impact both domestic and international travel. Post COVID-19, travel affordability is a concern to Australians due to the rising costs of living linked to the inflationary pressures in the recent economic climate. The Consumer Price Index (CPI) rose 3.8 per cent annually in FY23-24.7 While this is a lower annual rate than the previous 12-month period, where it was 6 per cent, these pressures are likely to contribute to how affordable travel is for many Australians, particularly younger Australians. This may be reflected in the shorter domestic overnight stays and less domestic day trips seen for FY23-24.

Economic pressures are also being felt globally in many key markets to NSW. Inflation has eased from the high levels seen in 2022-2023, with the annual percentage change in consumer prices for June 2024 at 3 per cent in the US, 2.9 per cent in Japan, 2.4 per cent in South Korea, and 2 per cent in the UK. Higher interest rates brought in to control inflation are impacting how much disposable income is available for travel.

Aviation - domestic market

INBOUND CAPACITY

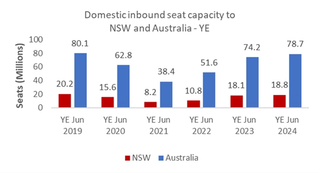
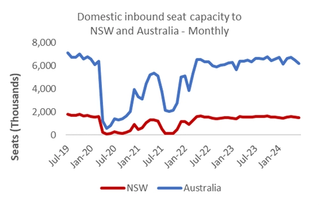
In FY23-24, NSW domestic aviation capacity (18,782,255 seats, up 4.0 per cent vs. FY22-23) accounted for 24 per cent of the domestic seats in Australia. After a rapid bounce-back since mid-2022, NSW domestic seat capacity remained steady with occasional fluctuations, before a slight drop in June 2024. Domestic seat capacity is at 93 per cent of FY18-19 level.

The three months closest to recovery were February 2024 (95 per cent), August 2023 (95 per cent), and April 2024 (94 per cent) when compared with the same months in 2019.

INBOUND TRAFFIC

In FY23-24, NSW saw 12,038,660 inbound domestic O&D (Origin & Destination) passengers. This is an increase on FY22-23, though still below FY18-19 levels.

The top three sources of domestic inbound traffic by O&D passengers in FY23-24 were Melbourne, Brisbane and the Gold Coast. This is unchanged from the FY22-23 and FY18-19 periods.

Aviation - International market

INBOUND CAPACITY

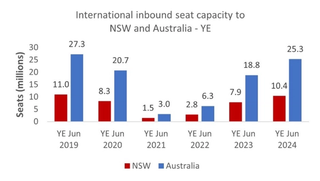
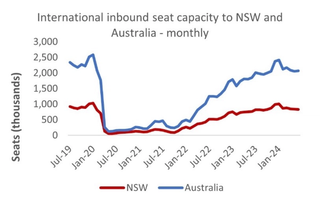
In FY23-24, NSW international aviation capacity (10,425,406 seats, up 32.6 per cent vs. FY22-23) accounted for 41 per cent of the international seats into Australia. International seat capacity into Australia also increased, up 34.4 per cent from the previous year. International seat capacity is at 95 per cent of FY18-19 levels. The three months closest to recovery were February 2024 (100 per cent), December 2023 (98 per cent), and January 2024 (98 per cent) when compared with the same months in 2019.

FY23-24 % CHANGE VS. FY22-23 % CHANGE VS. FY18-19

Total inbound seats (NSW): 10,425,406 (+32.6%) (-5.2%)

International travel has been trending toward its pre-COVID-19 numbers with airlines re-entering the market and expanding their routes. The top three foreign carriers by inbound seat to Sydney in the FY2023-24 period were Emirates (693,696), Air New Zealand (583,477), and Singapore Airlines (544,873).

New, resumed or seasonal international services into Sydney in FY23-24 include:

  • China Eastern Airlines: Auckland, Hangzhou, Nanjing, Jinan, Wuhan
  • Jetstar: Osaka-Kansai
  • Qantas: Port Moresby
  • Sichuan Airlines: Chengdu-Tianfu
  • Tianjin Airlines: Chongqing

INBOUND TRAFFIC

In FY23-24, NSW saw 6,826,461 inbound international O&D (Origin & Destination) passengers. This is a sharp increase on FY22-23, though still below FY18-19 levels.

The top three source countries of international inbound traffic by O&D passengers in FY23-24 were New Zealand, China, and the USA. This is unchanged from the pre-COVID FY18-19 period. Although outside the top three in FY22-23, China is now the number two international source market in FY23-24.

Accommodation

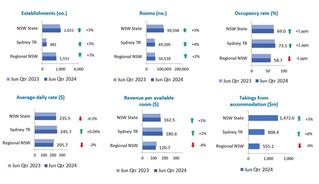
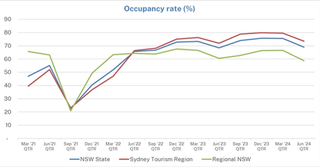
In FY23-24, the average occupancy rate in NSW rose by 3.2 per cent to 73.6 per cent compared to the same period in the previous year. This increase was mainly driven by a 5.1 per cent rise in occupancy in the Sydney tourism region (TR). Conversely, regional NSW saw a 1.1 per cent decline in occupancy rate compared to YE June 2023.

The average daily rate (ADR) for NSW also saw a 2.8 per cent increase to $260, driven by a 3.9 per cent increase in the Sydney TR. Revenue per available room (RevPAR) increased by 7.6 per cent to $192 statewide, largely due to an 11.2 per cent increase in the Sydney TR.

At the end of June quarter 2024, NSW’s accommodation sector comprised of 2,031 establishments and 99,598 rooms. This marked a 3.5 per cent increase in the number of establishments and a 3.0 per cent increase in the number of rooms compared to the same period in the previous year.

egional NSW accounted for 76 per cent of all establishments and 51 per cent of the state’s total rooms. The average occupancy rate increased by 1 per cent in NSW and by 1.7 per cent in the Sydney TR, while occupancy in regional NSW declined by 1.1 per cent.

The ADR in NSW saw a modest decline of 0.3 per cent, falling to $235, compared to the same quarter in 2023, primarily due to a 2.6 per cent drop in regional NSW.

Conversely, RevPAR increased by 1.2 per cent statewide to $163, driven by a 2.4 per cent rise in the Sydney TR. Regional NSW experienced a 4.3 per cent decrease in RevPAR against June quarter 2023.

NSW’s accommodation supply in the June quarter 2024 increased by 12 establishments and 69 rooms compared to the March quarter 2024. The state occupancy rate dropped by 6.5 per cent to 69 per cent from the previous quarter. The ADR for NSW also decreased compared to the previous quarter, with both Sydney and regional NSW experiencing declines.

Note: establishments refer to commercial accommodation facilities with 10 or more rooms.

Stay on top of visitor economy newsSubscribe to our newsletters